Creating a Wutch
We recommend you setting up our Browser Extension to streamline the process.
Same procedure as described below, but as a no-comment video.
- The hardest part: finding something useful for you to track.
Visit our Use Cases page for some inspiration.
- When on the page you want to track, click the extension icon
 in the browser.
If you have applied custom filtering or sorting on the page, such as "Newest" or "Most popular", the page may or may not reflect it in the address. An easy way to verify this is by copying the complete page address and pasting it into a new Incognito Tab. If the content remains the same as on the original page, Wutch will be able to capture those filters 👌.
-
Hover your mouse over the element containing precisely the value you want to track.
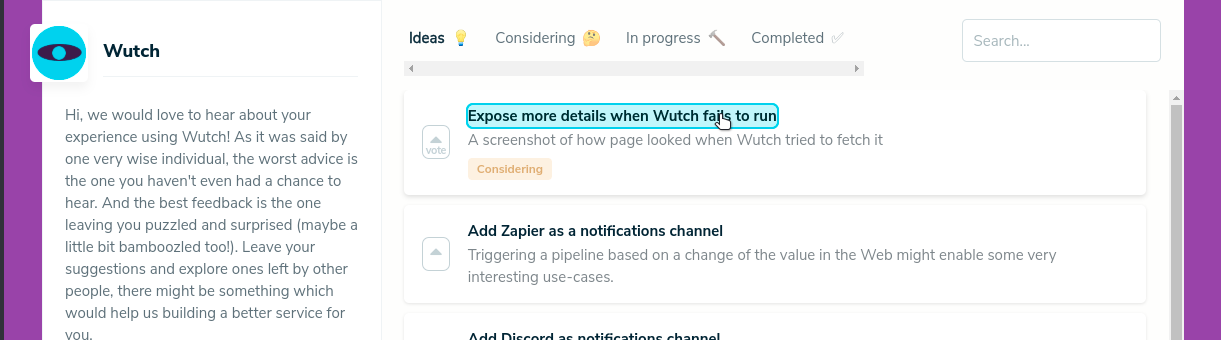
This is what you would select if you were subscribing to the latest feature suggestion for Wutch.
-
Click 🖱!
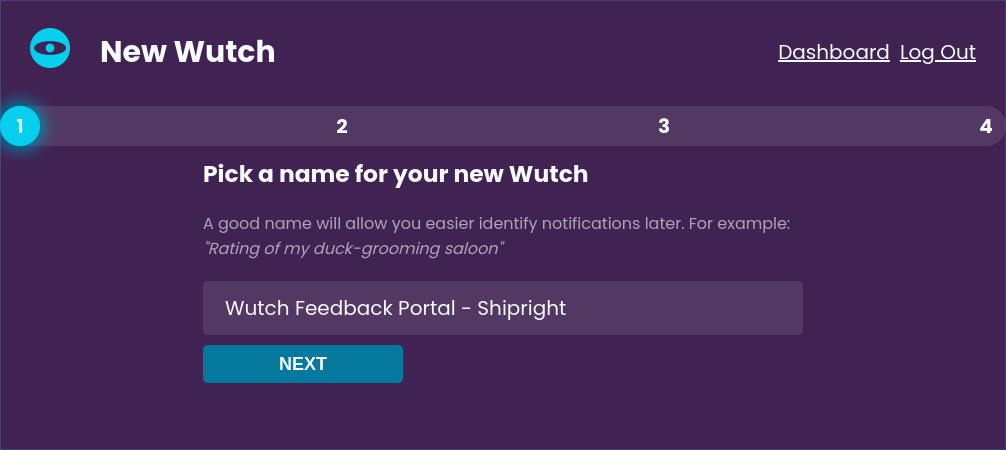
This action will open a new tab with a new Wutch screen, pre-configured with the page and selector you've just chosen.
- Adjust the Wutch name to your liking.
You will later see this name in change notifications to help you distinguish between the updates.
-
Verify that the URL of the page and the Selector were captured correctly.
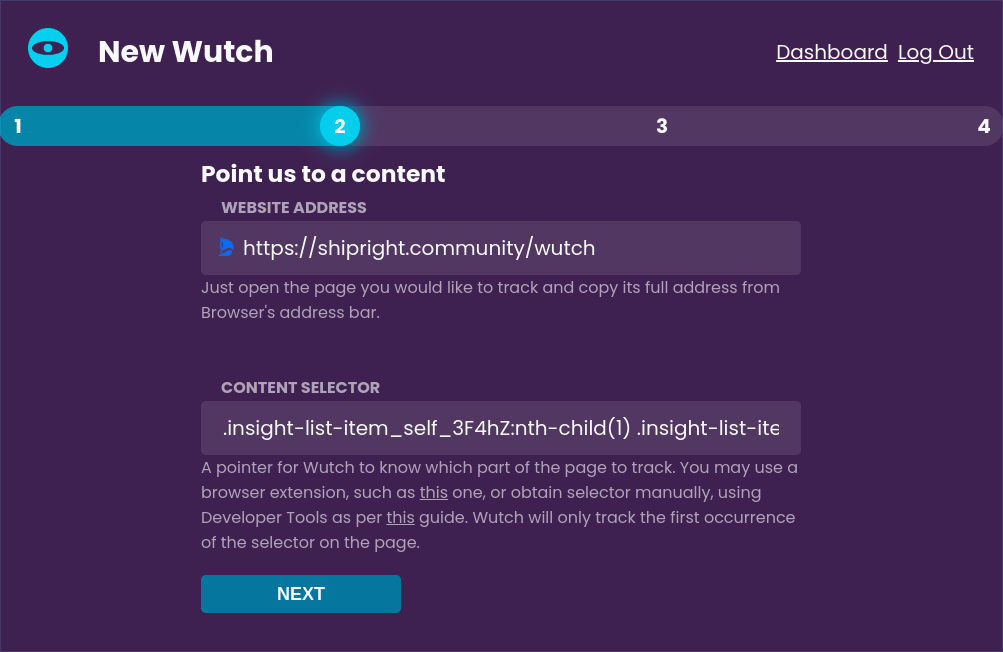
Generally, you won't need to make any adjustments to these values. However, if you have hands-on web development experience, you may certainly tweak these to your preference.
-
On the next screen, choose a Notification Channel to receive updates.
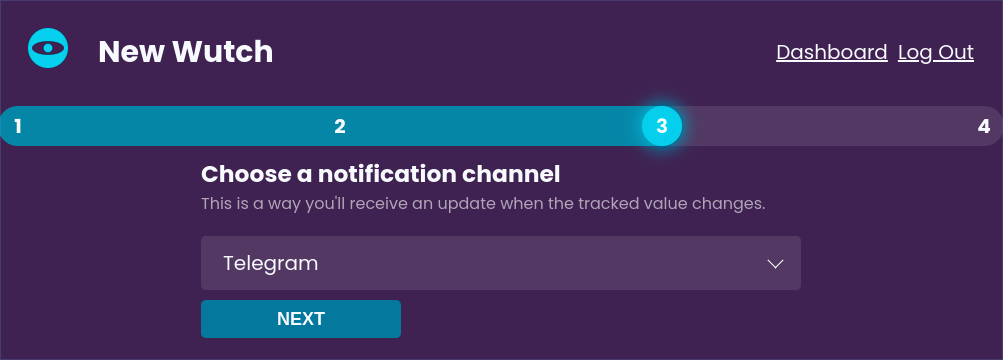
Check out our Channel docs for more information on creating new notification channels.
-
Upon proceeding, Wutch will run multiple checks, attempting to access the configured value. This process may take some time.
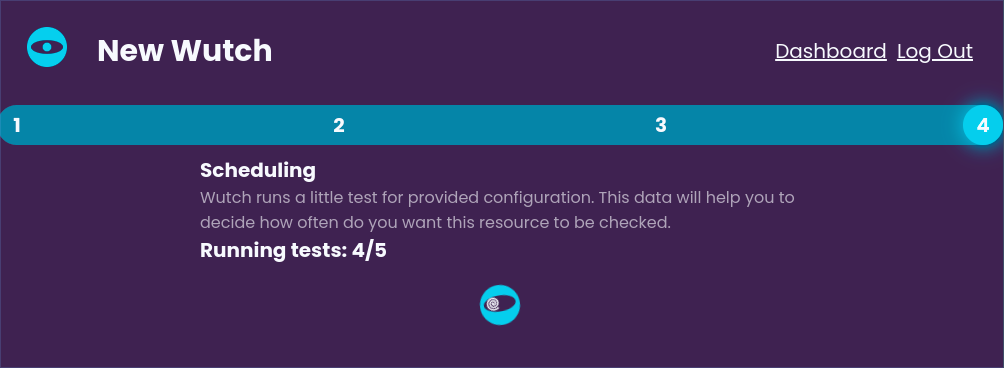
Wutch runs these tests to verify it can access the required value and to measure the approximate time it takes to load and process the page. The smaller and leaner the page, the less time will be needed. The less time required, the more Wutches could be run within your current plan limits.
Checks might fail due to various reasons, ranging from general network connectivity issues to full-fledged bot protection on the target website. You can learn more about these limitations in the Limitations section of the Wutch docs. -
If at least some checks succeed, you'll be able to observe the extracted value(s) on the next screen.
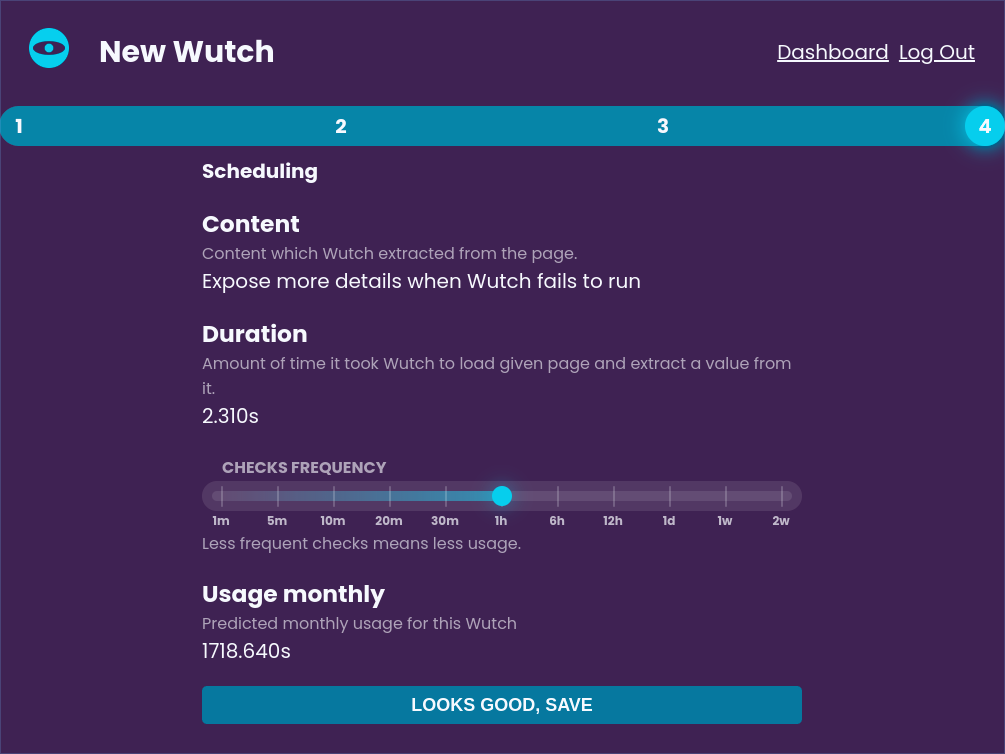
If Wutch finds different values during these separate checks, for example, because the values change very frequently, it will display all the extracted values. You can also see how much time on average it took Wutch to load and process the page. In general, it should be on par or faster than doing it from your computer, because Wutch runs in the ☁️ clouds ☁️, right where most websites live.
- Select desired check frequency and proceed with saving the Wutch
Check frequency can always be tweaked later, on a Wutch Details page.
It's by far the most important factor influencing your monthly service usage, so choose carefully. -
Observe a new Wutch added to your dashboard

It will schedule the very first check as soon as possible, typically within a couple of minutes. You'll be able to observe it right in the Wutches List.